The bet behind every planting
A planter deciding what to sow next month is making a bet. The weather has to cooperate, the crop has to be planted in its window, and — above all — the wholesale price has to be good when the harvest reaches the market, often three to five months later.
The agronomic half of that bet is well documented. FAREI, the Food and Agricultural Research and Extension Institute, publishes recommended crops and planting calendars for each climate zone. The market half is not.
What was missing
Wholesale prices at the National Wholesale Market (NWM) are public. The Agricultural Marketing Board publishes them as PDF reports for each trading day. But they are scattered across hundreds of files, they are historical, and nobody had connected them back to the planting decision that produced them.
So a grower looks at today’s price, not the price that will matter at harvest. The result is familiar: many people plant the same crop in the same window, and the price falls exactly when the harvest arrives.
Other pieces of the decision were just as spread out: weather records, the cyclone season, the cost of seedlings and fertiliser. Each is available somewhere. None of it was in one place, and none of it was expressed per arpent, the unit planters actually use.
What the tool does
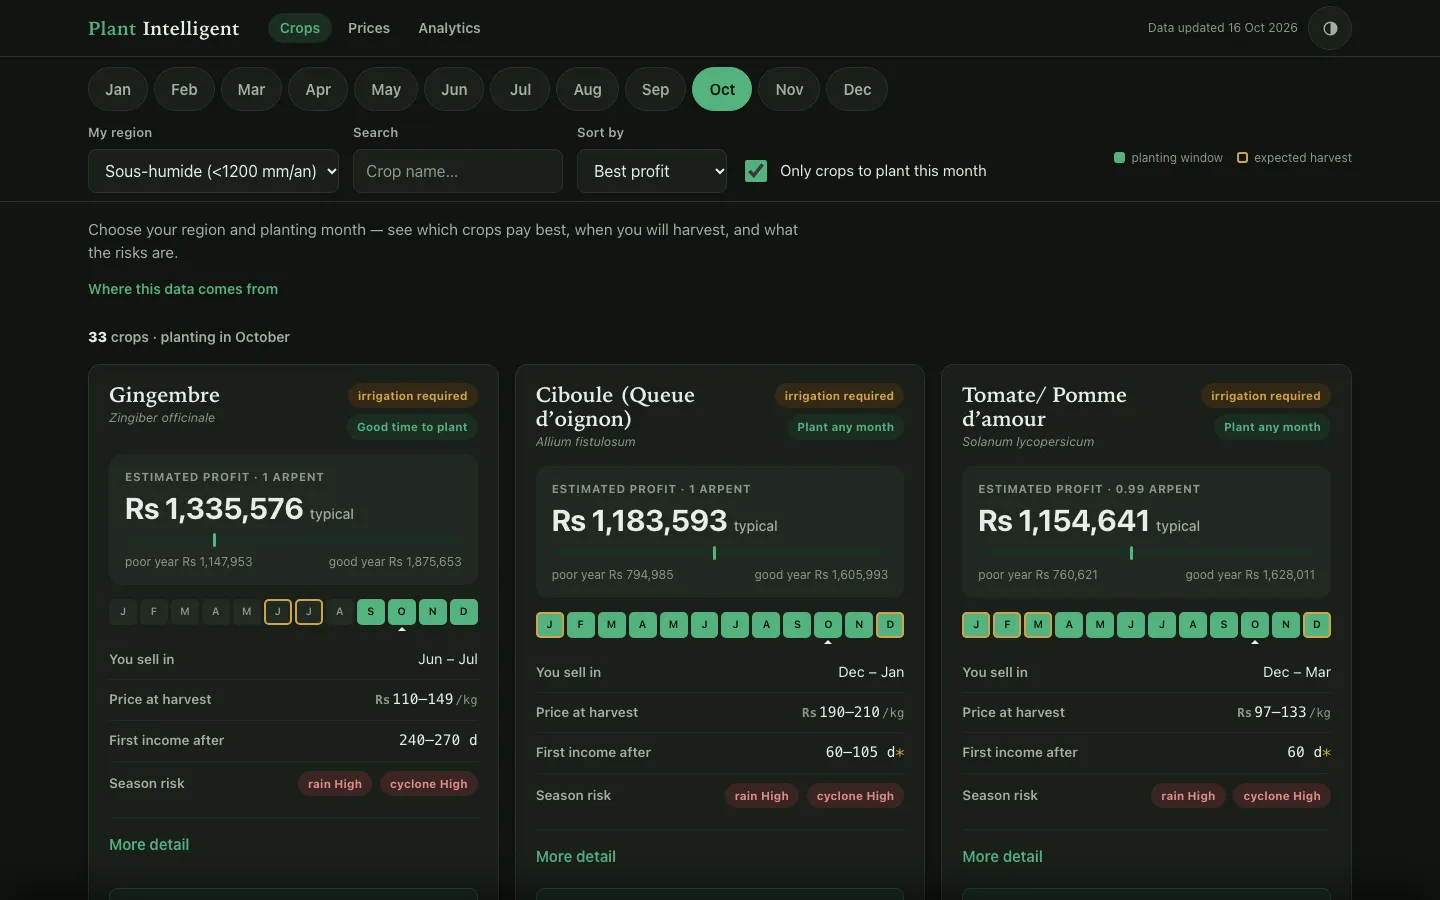
Mauritius Plant Wholesale Intelligence brings the two halves together. Choose your rainfall zone — sub-humid, humid or super-humid — and a planting month, and for each of the 47 crops recommended by FAREI it shows:
- the recommended planting window and the expected harvest months
- historical NWM wholesale prices for those harvest months — not today’s price, the one that actually matters
- heavy-rain and cyclone exposure across the growing season
- seedling and fertiliser costs, and profit per arpent for a poor, typical and good year
- price patterns by month and weekday, to help choose when to sell
How it works
Behind the interface, a set of scripts collects six public or published sources and joins them in one database: the NWM price reports, FAREI’s agricultural guide and planting calendar, weather records from the Plaisance and Vacoas stations, cyclone tracks within 500 km of Port Louis, fertiliser prices and seedling prices.
The profit scenarios are deliberately simple. A poor year combines the lowest yield in the guide with a low price for the harvest months; a typical year uses the middle yield and the median price; a good year, the highest yield and a high price. Seedling and fertiliser costs are then subtracted.
On trading days, a scheduled job looks for new market reports and republishes the site. As of October 2026 the database holds 84,828 price records from 695 market days since January 2024, across 194 traded vegetables and fruits.
What it does not do
It will not tell you what to plant. It shows what you are actually betting on, with the numbers side by side, so the decision stays yours — but informed rather than blind.
It also has honest limits. The margins are partial: they count seedlings and fertiliser, but not labour, irrigation, land or crop care. The weather and cyclone record starts in 2024, which is short. Some prices are sold per unit and converted to kilograms with assumed weights. And the estimates have not yet been checked against real harvests — that is the next step.
Who it is for, and what comes next
It is built for planters and producers — especially young planters — deciding what to sow next; for cooperatives and agricultural advisers who need to compare options quickly; and for anyone in the Mauritian food chain who has been surprised by a harvest-time price.
It is live, free and a first version. The most useful contribution now is feedback from people who work in the sector: what is wrong, what is missing, which data you would trust and which you would never use. That feedback is what the next version will be made of.
Questions
- Where can I see National Wholesale Market prices in Mauritius?
- The free Mauritius Plant Wholesale Intelligence tool at plants.jordanbienvenue.com shows daily NWM prices for vegetables and fruits since January 2024, read from the Agricultural Marketing Board’s published reports.
- Does the tool tell me what to plant?
- No. It puts the planting window, the expected harvest-time price, season risk and input costs side by side so you can compare options. The decision remains yours.
- How is profit per arpent estimated?
- For each crop, yields from the FAREI guide are combined with wholesale prices for the harvest months to give a poor, typical and good year, minus the cost of seedlings and fertiliser. Labour, irrigation and land are not included.